Difference between revisions of "Profiler graph"
Jump to navigation
Jump to search
(fix category name) |
(rename Minetest to Luanti) |
||
| Line 1: | Line 1: | ||
{{Incomplete}} | {{Incomplete}} | ||
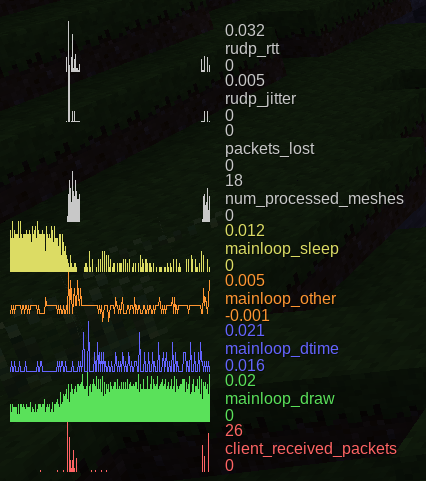
| − | The profiler graphs show the performance of | + | The profiler graphs show the performance of Luanti in a more detailed fashion. This information is useful for engine developers. The profiler graphs are shown when you hit the debug key (<kbd>F5</kbd> by default) twice. |
[[File:Profiler graph.png]] | [[File:Profiler graph.png]] | ||
Latest revision as of 22:30, 22 October 2024
|
|
This article is incomplete. Please help expand this article to include more useful information. |
The profiler graphs show the performance of Luanti in a more detailed fashion. This information is useful for engine developers. The profiler graphs are shown when you hit the debug key (F5 by default) twice.
The following graphs are available:
- rudp_rtt: ???
- rudp_jitter: ???
- packets_lost: ???
- num_processed_meshes: The engine generates geometric meshes from MapBlock data for drawing. This is the number of those meshes that finished generating in each frame.
- mainloop_sleep: If the game runs at a faster rate than
wanted_fps, a sleep is inserted into each frame after drawing in order to not consume excess resources; this is that sleep time in seconds. - mainloop_other: Time (in seconds) spent in each frame for everything else than drawing.
- mainloop_dtime: Total time (in seconds) spent per frame (
mainloop_other + mainloop_draw + mainloop_sleep); FPS = 1 divided by this, averaged. - mainloop_draw: Time (in seconds) spent in each frame for drawing (rendering).
- client_received_packets: Number of received high-level protocol packets in each frame.
